8th CPC Pay Matrix Calculator
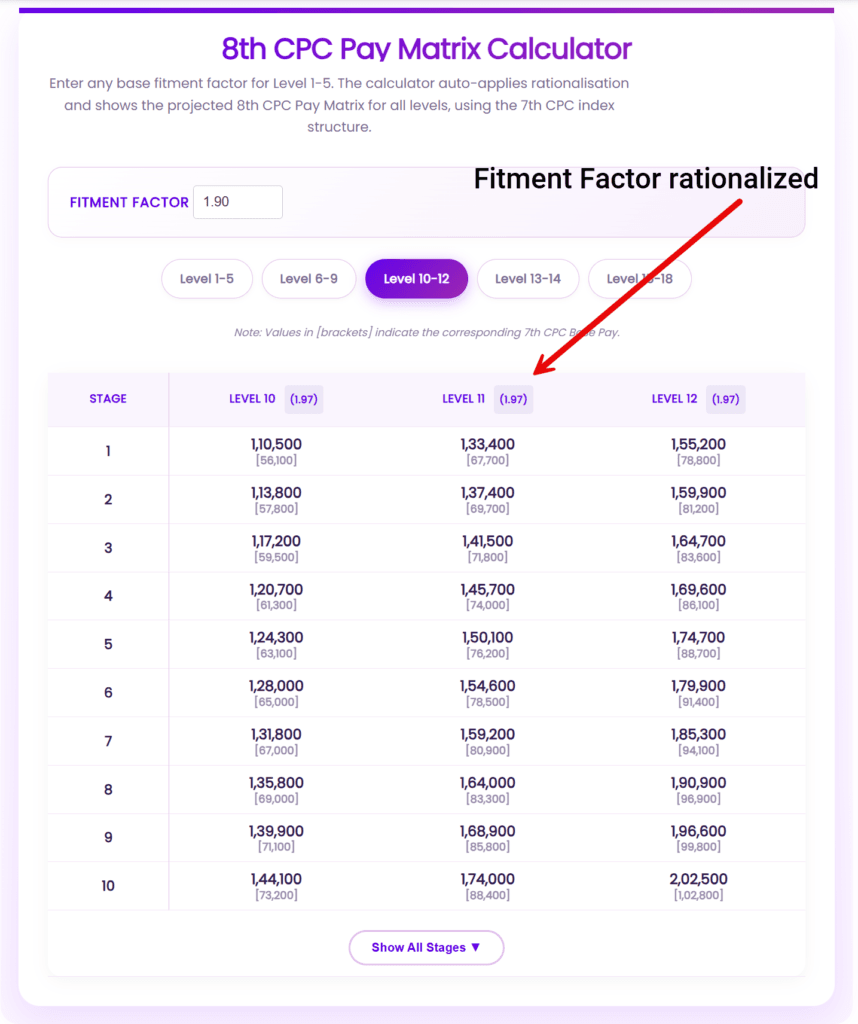
Enter any base fitment factor for Level 1-18. The calculator auto-applies rationalisation and shows the projected 8th CPC Pay Matrix for all levels, using the 7th CPC index structure.
Note: Values in [brackets] indicate the corresponding 7th CPC Base Pay.
| Stage | Level 1 (1.90) | Level 2 (1.90) | Level 3 (1.90) | Level 4 (1.90) | Level 5 (1.90) |
|---|---|---|---|---|---|
| 1 |
34,200
[18,000] |
37,800
[19,900] |
41,200
[21,700] |
48,500
[25,500] |
55,500
[29,200] |
| 2 |
35,200
[18,500] |
38,900
[20,500] |
42,400
[22,400] |
50,000
[26,300] |
57,200
[30,100] |
| 3 |
36,300
[19,100] |
40,100
[21,100] |
43,700
[23,100] |
51,500
[27,100] |
58,900
[31,000] |
| 4 |
37,400
[19,700] |
41,300
[21,700] |
45,000
[23,800] |
53,000
[27,900] |
60,700
[31,900] |
| 5 |
38,500
[20,300] |
42,500
[22,400] |
46,400
[24,500] |
54,600
[28,700] |
62,500
[32,900] |
| 6 |
39,700
[20,900] |
43,800
[23,100] |
47,800
[25,200] |
56,200
[29,600] |
64,400
[33,900] |
| 7 |
40,900
[21,500] |
45,100
[23,800] |
49,200
[26,000] |
57,900
[30,500] |
66,300
[34,900] |
| 8 |
42,100
[22,100] |
46,500
[24,500] |
50,700
[26,800] |
59,600
[31,400] |
68,300
[35,900] |
| 9 |
43,400
[22,800] |
47,900
[25,200] |
52,200
[27,600] |
61,400
[32,300] |
70,300
[37,000] |
| 10 |
44,700
[23,500] |
49,300
[26,000] |
53,800
[28,400] |
63,200
[33,300] |
72,400
[38,100] |
Use this 8th CPC Pay Matrix Calculator to generate the expected basic pay across all pay levels. Just enter the fitment factor you want to test (at this stage, fitment factor is the main value we can use for estimation), and the tool will handle the remaining part. It auto applies rationalisation based on the 7th CPC index pattern and shows the projected 8th CPC pay matrix level wise. To make it easy to compare, it also displays the 7th CPC basic pay in brackets for reference.
What is pay matrix table?
A pay matrix table is basically the salary chart used for Central Government employees under the 7th pay commission (7th CPC). Before 7th CPC, salary calculation was kind of disorganized because we had pay bands, grade pay, different scales and all that. But in 7th CPC, the Government brought one single chart or table called the pay matrix, and it shows your basic pay clearly.
Here is the 7th pay matrix table released by the commission. Download PDF.
This matrix tells you one simple thing, that, how your basic pay grows over the years.
How the pay matrix is arranged
The pay matrix has two directions. The columns are levels. These levels show your position or job level. For example, Level 1 is entry level, and Level 10, Level 13, Level 18 etc. are senior posts. The rows are stages (cells). These stages show what happens to your pay every year. So once you enter a level, your pay moves stage by stage as you get annual increments.
What is fitment factor and why 2.57 is used
When the 7th CPC was announced, the Pay Commission used a number called the fitment factor (2.57) to move salaries from the old 6th CPC system into the new pay structure. Based on this, they created the Pay Matrix table, which shows the revised basic pay for employees across different levels and stages.
They used 2.57 as a common base so the shift to the new system stays uniform for everyone. That’s why this number is seen as the starting point of the 7th CPC pay structure. But here’s the common confusion. 2.57 doesn’t mean everyone got the exact same hike. Higher pay levels follow a slightly different pattern because the Commission also gave extra weight to senior levels to maintain proper gaps in pay.
Rationalisation: why higher levels look different
Along with the fitment factor, the 7th CPC also use something called rationalisation.
It may sound technical, but the idea is simple. While preparing the pay matrix, the Pay Commission gave a slightly higher push to senior levels so that the pay gap between junior and senior officers stays meaningful.
That’s why the pay matrix shows an index of rationalisation, and it slowly increases as the level goes up. So even though 2.57 is the base number, the increase is not exactly the same across all levels. For example check Level 10 once. You’ll see it gets a slightly higher multiplier and that’s rationalisation at work.
How pay matrix cells are calculated (is it 3%?)
Yes, in most cases, the stages in pay matrix move by 3% each year.
The logic is simple.
Next cell = current cell × 1.03
After that, the matrix rounds off the value. That’s why you don’t see weird numbers with decimals. They keep the figures clean so salary calculation becomes easy.
Example using level 1.
Level 1 starts at ₹18,000.
Next stage:
₹18,000 × 1.03 = ₹18,540
Next stage:
₹18,540 × 1.03 = ₹19,096 (rounded to ₹19,100)
Next stage:
₹19,100 × 1.03 = ₹19,673 (rounded to ₹19,700)
So that’s why pay looks like this:
₹18,000 -> ₹18,540 ->₹19,100 -> ₹19,700.
Some exceptions you should know
Most of the time this 3% rule works. But not always. Sometimes an employee may not get annual increment because of service rules (like non qualifying service period, disciplinary issues, etc). Also during promotion or MACP, pay fixation follows a different rule. In such cases, you might jump to a higher cell directly instead of just moving to the next stage.
8th CPC pay matrix table calculation based on 7th CPC
Now that you understand what a pay matrix table is and what information it gives, let’s come to our main topic: how to calculate the 8th Pay Commission pay matrix table.
We already have an 8th CPC salary calculator which helps you estimate the expected in-hand salary after the revision. We also have a fitment factor calculator, since fitment factor is the base for any pay matrix calculation. So once you choose a fitment factor (for example 2.0), you can multiply the current 7th CPC pay matrix using that value to estimate the 8th CPC pay matrix.
How to use 8th pay commission pay matrix calculator
Our calculator works based on the logic explained just above. The good part is, it doesn’t just multiply blindly. It automatically applies rationalisation for different pay levels, based on how the 7th CPC used a slightly higher index for senior levels.
So all you need to do is enter the expected fitment factor, and the calculator will generate the projected pay matrix instantly. You can then copy the revised basic pay values from the table for arrears or pension calculations.
For convenience and faster navigation, we have arranged the levels into capsules, so you can quickly switch between them. Each level heading shows the corresponding rationalised fitment factor for that level based on your input. The basic salary as per the 7th CPC Pay Matrix is also provided for reference.